
Wind power capacity factor is the ratio of a turbine’s actual energy output over a given period to the maximum output it could theoretically produce if it ran at full capacity the entire time. Expressed as a percentage, this metric reveals how effectively a wind farm converts available wind resources into electricity. While a coal or nuclear plant might achieve capacity factors of 85% or higher because fuel supply is controllable, wind turbines depend on an intermittent resource and typically operate at capacity factors between 25% and 55%, with modern offshore installations pushing toward the upper end of that range.
Understanding capacity factor is essential for anyone evaluating wind projects, whether you’re a utility planning grid integration, an investor assessing project economics, or a community member weighing the benefits of local wind development. This metric directly influences revenue projections, financing terms, and the environmental impact calculations that justify renewable energy investments. A project with a 40% capacity factor will generate nearly twice the electricity of one at 25%, fundamentally changing its financial viability and carbon offset potential.
This article breaks down how capacity factor works in practice, explores the physical and geographic variables that drive performance differences, and shows how developers and operators use this metric to optimize turbine placement, select appropriate technology, and deliver reliable clean energy. By 2026, as wind power continues expanding across diverse landscapes and offshore waters, mastering capacity factor has become central to maximizing the performance and economic returns that make wind energy a cornerstone of the clean energy transition.
What Capacity Factor Means for Wind Energy

Capacity factor represents the bridge between a wind turbine’s potential and its real-world performance. At its core, it’s the ratio of actual electricity generated over a specific period compared to the theoretical maximum the turbine could produce if running at full nameplate capacity every hour of that timeframe.
Here’s how it works in practice. A 3-megawatt turbine has the theoretical ability to produce 26,280 megawatt-hours annually if it operated at maximum output 24 hours a day, 365 days a year. But wind doesn’t blow constantly at optimal speeds. If that same turbine actually generates 9,198 megawatt-hours in a year, its capacity factor is 35%. The turbine delivered 35% of what it would have produced under perfect, continuous conditions.
- Nameplate Capacity
- The maximum power output a wind turbine can generate under ideal conditions, measured in kilowatts or megawatts. This represents the ceiling for what the equipment can physically produce.
- Actual Output
- The real electricity a turbine generates over a given period, accounting for variable wind speeds, downtime, and operational constraints. This fluctuates based on weather patterns and site conditions.
- Capacity Factor Percentage
- The ratio of actual output to maximum possible output, expressed as a percentage. A 40% capacity factor means the turbine produced 40% of what it theoretically could have generated.
- Annual Energy Production
- The total electricity a wind project delivers over a full year, measured in megawatt-hours or gigawatt-hours. This figure directly determines revenue and environmental impact.
Modern wind farms typically achieve capacity factors of 30.8%, 40.7% with offshore installations sometimes pushing higher due to more consistent wind resources. These numbers might seem modest, but they reflect the inherent variability of wind as an energy source rather than equipment failure or inefficiency.
Compared to other power generation technologies, wind’s capacity factors tell an important story. Coal and natural gas plants often run at 50-60% capacity, constrained by market demand and grid requirements rather than fuel availability. Nuclear facilities can exceed 90%, running almost continuously. Solar installations average 20-25%, limited by nighttime and weather. Wind falls in the middle range, delivering reliable clean energy without fuel costs or emissions while working within nature’s patterns.
Understanding these benchmarks helps set realistic expectations. A wind project with a 38% capacity factor isn’t underperforming, it’s operating right where physics and meteorology dictate for that location and technology combination.
How Wind Power Capacity Factor Works
The Role of Wind Variability
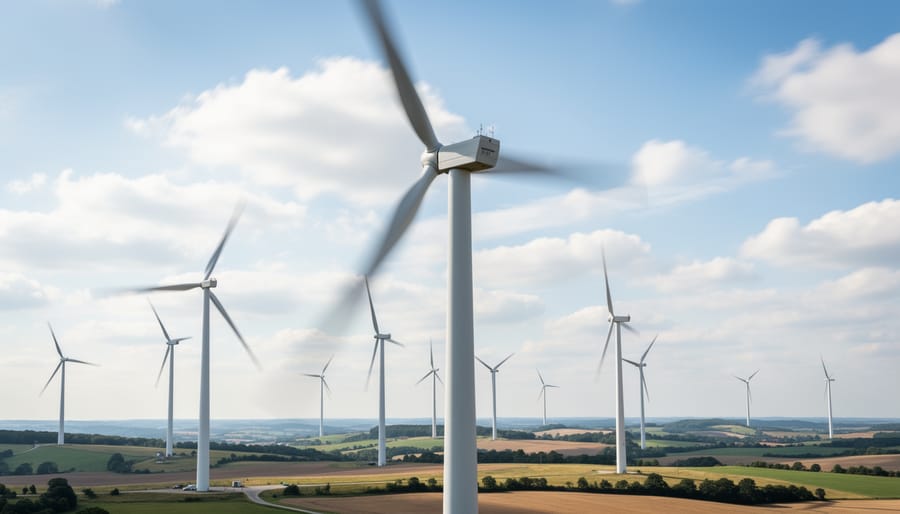
Wind speed isn’t constant, it shifts hour by hour, season by season, and with every weather system that rolls through. A turbine might spin at peak output during a windy afternoon, then barely turn overnight when conditions calm. These fluctuations mean turbines can’t run at full capacity continuously, which directly shapes their capacity factor.
Even at exceptional sites with strong, consistent winds, capacity factors typically range from 40% to 50%. The physics of wind itself creates this ceiling. Wind doesn’t blow at optimal speeds all the time; periods of low wind reduce output, while extremely high winds trigger automatic shutdowns for safety. Seasonal patterns add another layer, many regions experience windier winters and calmer summers, or vice versa.
Daily cycles matter too. Coastal sites often see stronger afternoon sea breezes, while Great Plains locations may experience nocturnal wind jets after sunset. This natural intermittency is why a 50% capacity factor represents excellent performance rather than mediocrity. It reflects the reality that wind is a variable resource, not a limitation of the technology. Understanding this variability helps set realistic expectations and guides strategies for balancing wind power with other energy sources or storage systems.
Turbine Technology and Design Factors
Modern turbine engineering has transformed capacity factor performance dramatically over the past decade. Today’s utility-scale turbines stand 80 to 100 meters tall, sometimes higher, placing their rotors into stronger, more consistent wind currents well above ground-level turbulence. This elevation advantage alone can boost capacity factors by 5 to 10 percentage points compared to older, shorter machines.
Rotor diameter expansion plays an equally vital role. Current turbines feature blades spanning 120 to 150 meters, sweeping vastly larger areas to capture energy from the same wind resource. A turbine with a 140-meter rotor diameter covers roughly twice the swept area of an 80-meter model, harvesting significantly more power from moderate winds that would barely turn smaller blades.
Advanced pitch control systems now adjust blade angles continuously in response to wind conditions, optimizing performance across a wider speed range. These controls allow turbines to start generating at winds as low as 3 meters per second and continue operating efficiently through variable gusts. Coupled with sophisticated yaw mechanisms that keep rotors precisely aligned with shifting wind directions, these technologies ensure turbines extract maximum energy from available resources. The result is modern machines achieving capacity factors of 40 to 50 percent at quality sites, compared to 25 to 35 percent from turbines installed just 15 years ago.
Factors That Determine Capacity Factor Performance
Geographic and Environmental Components
Geographic considerations fundamentally determine a wind project’s capacity factor potential before a single turbine is installed. Wind resource quality varies dramatically by location, coastal regions and elevated ridgelines consistently outperform interior valleys due to stronger, more consistent wind patterns. Sites at higher elevations capture faster, less turbulent airflow, while proximity to forests, buildings, or terrain features creates wake effects and turbulence that reduce both wind speed and energy capture.
Local climate patterns shape seasonal and daily wind availability. Areas with steady prevailing winds maintain higher capacity factors than locations experiencing calm periods or highly variable conditions. Temperature extremes, icing events, and storm frequency also impact operational hours and performance.
Offshore wind projects achieve substantially higher capacity factors than onshore installations, often reaching 40-50% compared to onshore averages of 30-35%. European offshore projects have demonstrated offshore wind 62.3% capacity factor in optimal conditions. Ocean environments provide stronger, more consistent winds with minimal surface obstacles, though they introduce unique challenges including saltwater corrosion and extreme weather exposure. The smoother water surface reduces turbulence, allowing turbines to operate more efficiently across a wider range of conditions.
Operational and Management Components
Unlike site characteristics determined by nature, operational factors rest largely in human hands. How a project team manages turbines directly shapes realized capacity factor.
Scheduled maintenance windows temporarily reduce output but protect long-term performance. Regular inspections, blade cleaning, and component replacements keep turbines operating at design specifications. Deferred maintenance compounds into efficiency losses that drag capacity factor downward over years.
Grid availability presents another critical variable. When transmission infrastructure reaches capacity or experiences outages, even functioning turbines must disconnect. Curtailment, utility-mandated reductions in generation, occurs during periods of oversupply or grid congestion, cutting actual output below what wind conditions allow.
Regulatory compliance adds another layer. Meeting zoning compliance permits and broader regulatory requirements sometimes necessitates operational adjustments, shadow flicker mitigation, noise controls during certain hours, or seasonal shutdowns protecting wildlife migration, that reduce annual generation hours.
Performance optimization strategies counterbalance these constraints. Advanced monitoring systems identify underperforming turbines quickly. Predictive analytics schedule maintenance during low-wind periods, minimizing lost generation. Proactive management transforms operational challenges into opportunities for capacity factor improvement.
How Capacity Factor Guides Wind Project Development

Capacity factor projections shape every major decision in wind project development, from the initial site evaluation to securing financing and setting performance expectations with utilities. Developers start by analyzing multi-year wind resource data to estimate a site’s likely capacity factor, understanding that this single metric directly translates to revenue potential and project viability.
Site selection hinges on capacity factor forecasts. A location with predicted capacity factors above 40% will attract investment far more readily than a marginal site projecting 25%, even if the latter has lower land costs. Developers compare wind resource assessments across candidate sites, weighing higher capacity factors against transmission access, permitting complexity, and construction expenses to identify the optimal balance.
Financial modeling relies heavily on conservative capacity factor estimates. Investors and lenders scrutinize these projections because capacity factor determines how much electricity a project will sell over its 20-30 year lifetime. A single percentage point difference in capacity factor can shift project revenues by millions of dollars, affecting debt coverage ratios and return on investment calculations. Banks typically require developers to use P50 or P90 capacity factor estimates, meaning 50% or 90% probability of achieving that level, to ensure financial models reflect realistic performance rather than best-case scenarios.
What is a good capacity factor for wind projects?
Onshore wind farms typically achieve capacity factors between 30-45%, while offshore projects often reach 45-55% due to stronger, more consistent winds. Anything above 40% onshore is considered excellent performance.
How does capacity factor affect project economics?
Capacity factor directly determines annual energy production and revenue. A project with 40% capacity factor generates about 33% more electricity than one at 30%, dramatically improving return on investment and lowering the cost per megawatt-hour delivered.
Why do capacity factors vary between projects?
Wind resource quality, turbine technology, site elevation, obstacles, seasonal weather patterns, and operational factors like maintenance schedules or grid curtailment all contribute to capacity factor differences between projects.
Can capacity factor predict future performance?
Capacity factor projections based on multi-year wind data provide reliable estimates, though actual performance depends on equipment reliability, operational decisions, and grid conditions. Historical capacity factors from similar sites in the region offer the best predictive baseline.
Wind Unites Us applies capacity factor analysis throughout stakeholder engagement, helping communities and landowners understand what turbine performance means in practical terms. Rather than discussing abstract megawatt ratings, we translate capacity factor projections into concrete figures, how many homes a project will power, how much carbon it will displace, and what economic benefits the community can expect. This approach transforms technical metrics into relatable outcomes, building trust and informed support for wind development. Performance benchmarking against capacity factor targets continues after construction, allowing operators to identify underperforming turbines, optimize maintenance schedules, and validate the initial projections that secured project approval and financing.
Capacity Factor’s Impact on Energy Planning and Economics
Capacity factor shapes every financial and operational decision in wind energy development. When developers model a project’s revenue potential, capacity factor directly determines how much electricity they can sell under power purchase agreements. A site with a 40% capacity factor will generate roughly 15% more annual revenue than one at 35%, making the difference between a profitable investment and a marginal one.
This metric fundamentally influences levelized cost of energy, the average cost per kilowatt-hour over a project’s lifetime. Higher capacity factors spread fixed costs across more energy production, lowering LCOE and making wind competitive with conventional generation. Modern turbines achieving 45-50% capacity factors at premium sites now deliver electricity costs below natural gas in many markets, eliminating the need for subsidies to compete.
Grid operators rely on capacity factor forecasts for integration planning. A wind farm with predictable 38% annual capacity factor allows utilities to plan backup generation and storage more efficiently than one with erratic 28% performance. This predictability reduces balancing costs and makes wind more valuable to the grid.
For states like Kansas wind power development, strong capacity factors translate to tangible economic benefits, more tax revenue per turbine, greater landowner lease payments relative to infrastructure footprint, and faster returns on community investment in clean energy.
Financial institutions evaluating wind projects scrutinize capacity factor projections with particular care. A single percentage point difference across a 20-year power purchase agreement can represent millions in revenue variation, affecting debt terms, equity returns, and ultimately whether a project secures financing. This financial reality drives developers to invest in thorough resource assessment and optimal turbine selection rather than simply maximizing nameplate capacity.
Capacity factor stands at the intersection of engineering potential and real-world performance, revealing how effectively a wind turbine converts available wind resources into usable electricity. While theoretical maximum output provides a baseline, capacity factor tells the complete story of how much clean energy a project actually delivers to the grid year after year.
At Wind Unites Us, optimizing capacity factor drives every decision we make. Our site selection process combines decades of wind resource data with advanced modeling to identify locations where turbines will achieve their highest performance. We partner with leading manufacturers to deploy the latest turbine technology, from taller towers that access stronger winds to larger rotors that capture energy at lower speeds. Our ongoing performance monitoring ensures projects maintain peak efficiency throughout their operational lifetime.
Higher capacity factors translate directly into environmental progress. Each percentage point improvement means more renewable electricity displacing fossil fuel generation, reducing emissions without installing additional infrastructure. As capacity factors continue rising through technological advancement and operational excellence, wind energy becomes an increasingly powerful force within the clean energy mix accelerating our collective transition to sustainable power.